In 2014, the makers of the ACT rolled out a new pre-ACT test: the ACT Aspire. Unlike the ACT Plan, which was given just to tenth graders, the ACT Aspire is meant to be given to 3 rd through 11 th graders, with the goal of testing Common Core standards as well as ACT readiness.
The ACT Aspire has its own scoring scale, content, and goals compared to the ACT. But it provides a predicted ACT score based on your performance. So is that predicted score accurate? We’ll give you the answer.
Before we get into the details of Aspire, it’s helpful to know about the ACT’s old pre-ACT test: the ACT Plan. It was an ACT-style test for tenth graders, shorter in length than the ACT, but with similar questions.
Like the ACT, the Plan was a traditional paper and pencil multiple choice test. It did not include a writing section like the ACT Plus Writing does.
The ACT Plan was essentially considered the ACT’s version of the PSAT – a shorter, less-difficult version of the same test.
ACT also offered the Explore test for 8 th and 9 th graders. Explore was also a version of the ACT, but shorter and designed to predict the future success of middle school students.
The Plan was scored between 1-32, whereas the ACT is scored between 1-36. It predicted an ACT score between 1 and 5 points higher than the Plan score.
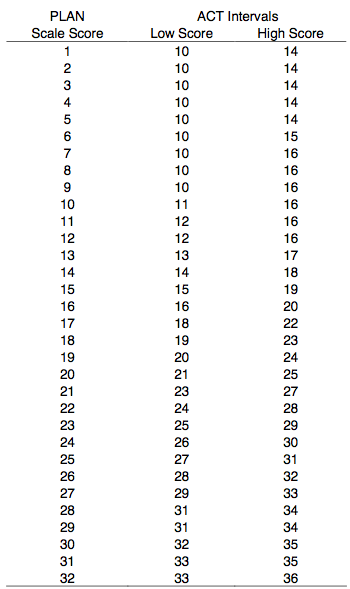
Table 1. Score predictions via ACT Plan.
For example, a plan score of 32 mapped to an ACT score between 33 and 36.
These predictions were by no means set in stone. Some students would score higher than the PLAN predicted because they didn’t really try on the Plan and took it without studying, whereas they would study for the ACT. It’s easy to find archived discussions online about Plan scores and ACT scores, with many students reporting they outscored their Plan predictions by 5-10 points.
Sometimes, students would also fail to meet their Plan predictions, since the Plan doesn’t have the same depth as the ACT, especially on the math section (there was less plane geometry and no trigonometry on the Plan).
The old ACT Plan website itself says to “Keep in mind that these scores are only estimates, not guarantees. Improving your study habits and taking more challenging courses are likely to improve your ACT scores.”
So even with a test very similar to the ACT, the estimated ACT score was just that – an estimation. So what happens with something as different as the ACT Aspire?
Aspire is a new test for third through eleventh graders designed to assess the new Common Core standards and college readiness, with alignment to the ACT subject areas. That means it tests Math, Reading, English, Writing, and Science.
Aspire can be taken with computers or on paper, though paper is more expensive, so most schools are using the computer-based test. This is different than the ACT, which is still given on paper.
Aspire is still quite new. It rolled out in 2014 and schools are adjusting to the change. It’s more expensive than the Plan, and many schools are still new to giving computer-based standardized tests.
Unlike the ACT, Aspire doesn’t just have multiple-choice questions. There are short writing responses, longer responses including essays and narratives, questions that have you construct an argument or timeline, math questions that have you explain why someone else’s work is incorrect, and lists that you have to select all of the correct answers from.
ACT is hoping Aspire will become the national standard for testing college readiness and Common Core standards, similar to other achievement tests like the PARCC.
Aspire is not graded like the Plan with an ACT-like scale. Instead, it assigns scores between 400 and 460 for each subject. We have included the current score ranges for each subject below.
This score scale lists the score ranges for each grade from 3 to 10. Note that while the bottom of the range is consistent, Aspire expects students to steadily improve over time as they acquire more knowledge in each grade.

The ACT Aspire website also provides score benchmarks for each grade, in addition to the score ranges. You can see the benchmarks for each grade for the Math test below.


These score scales are obviously quite different from the ACT's 1-36 range, and even the Plan's 1-32 range.
However, the ACT still uses those scores to map to future ACT scores, based on when you took the test. For example, they would predict a higher future ACT score if an eigth grader earned a 425 versus a tenth grader, since an eight grader has more time to learn and improve.
Since Aspire is new, there isn’t a ton of data yet to see if their ACT score predictions match up with what students actually earn. It will take a few years of students taking Aspire and then going on to take the ACT as juniors and seniors to get a sense of how accurately Aspire maps to ACT scores.
Still, we will examine some of the data ACT has released to give you a rough idea of how they predict scores will match up – and help you interpret a score you have already received!
ACT has released a data sample of 50 students, showing their Aspire scores in tenth grade, and their ACT scores in eleventh grade. It's just one sample, but we can use it to start exploring how Aspire scores translate to ACT scores.
| Aspire English | ACT English | Aspire Math | ACT Math | Aspire Reading | ACT Reading | Aspire Science | ACT Science |
| 411 | 8 | 411 | 11 | 410 | 13 | 414 | 10 |
| 411 | 17 | 414 | 15 | 413 | 14 | 415 | 17 |
| 413 | 16 | 417 | 19 | 414 | 15 | 415 | 16 |
| 419 | 14 | 417 | 16 | 415 | 16 | 416 | 17 |
| 419 | 10 | 418 | 16 | 415 | 20 | 417 | 20 |
| 422 | 12 | 419 | 19 | 415 | 19 | 417 | 16 |
| 423 | 11 | 420 | 15 | 416 | 12 | 419 | 15 |
| 424 | 10 | 420 | 16 | 419 | 17 | 419 | 19 |
| 424 | 10 | 421 | 22 | 420 | 17 | 419 | 17 |
| 425 | 14 | 421 | 17 | 420 | 22 | 421 | 18 |
| 425 | 15 | 421 | 15 | 421 | 22 | 421 | 21 |
| 425 | 17 | 422 | 19 | 421 | 19 | 421 | 22 |
| 426 | 16 | 422 | 20 | 422 | 23 | 422 | 22 |
| 427 | 19 | 422 | 17 | 422 | 19 | 424 | 18 |
| 427 | 12 | 423 | 16 | 422 | 17 | 424 | 19 |
| 428 | 21 | 424 | 22 | 422 | 19 | 424 | 17 |
| 428 | 20 | 424 | 16 | 423 | 14 | 425 | 17 |
| 428 | 22 | 425 | 15 | 424 | 23 | 427 | 21 |
| 428 | 21 | 425 | 18 | 424 | 21 | 427 | 13 |
| 430 | 17 | 426 | 16 | 424 | 18 | 427 | 18 |
| 430 | 20 | 426 | 17 | 425 | 16 | 427 | 23 |
| 432 | 19 | 427 | 22 | 426 | 24 | 427 | 24 |
| 433 | 21 | 428 | 15 | 426 | 16 | 427 | 20 |
| 434 | 16 | 428 | 23 | 427 | 18 | 428 | 15 |
| 434 | 22 | 429 | 23 | 427 | 16 | 428 | 19 |
| 435 | 23 | 430 | 20 | 427 | 18 | 429 | 21 |
| 436 | 21 | 430 | 19 | 427 | 18 | 429 | 23 |
| 436 | 22 | 431 | 26 | 427 | 25 | 429 | 13 |
| 437 | 22 | 431 | 25 | 427 | 23 | 429 | 25 |
| 437 | 20 | 432 | 23 | 428 | 22 | 430 | 21 |
| 437 | 26 | 432 | 17 | 428 | 26 | 430 | 23 |
| 437 | 21 | 432 | 24 | 429 | 20 | 430 | 25 |
| 438 | 26 | 434 | 23 | 429 | 26 | 431 | 20 |
| 438 | 23 | 434 | 22 | 429 | 23 | 431 | 19 |
| 439 | 25 | 434 | 21 | 429 | 19 | 431 | 24 |
| 439 | 23 | 437 | 28 | 429 | 31 | 433 | 20 |
| 439 | 32 | 437 | 26 | 429 | 22 | 434 | 26 |
| 439 | 24 | 437 | 19 | 431 | 21 | 434 | 23 |
| 440 | 28 | 437 | 23 | 432 | 28 | 435 | 28 |
| 440 | 31 | 438 | 28 | 432 | 29 | 435 | 24 |
| 441 | 26 | 438 | 28 | 432 | 30 | 436 | 28 |
| 442 | 25 | 441 | 27 | 432 | 21 | 436 | 23 |
| 442 | 28 | 442 | 26 | 434 | 28 | 437 | 27 |
| 442 | 24 | 443 | 29 | 434 | 23 | 439 | 24 |
| 443 | 24 | 443 | 27 | 434 | 25 | 440 | 30 |
| 443 | 33 | 443 | 28 | 434 | 33 | 440 | 25 |
| 444 | 26 | 444 | 28 | 435 | 31 | 441 | 30 |
| 447 | 31 | 446 | 32 | 435 | 31 | 442 | 29 |
| 448 | 32 | 448 | 33 | 435 | 32 | 442 | 33 |
| 448 | 35 | 455 | 30 | 435 | 34 | 443 | 34 |
Table 2. ACT Aspire to ACT Score Equivalencies
As the Aspire score increases, the ACT score generally increases, though there is no steady pattern or prediction for what kind of Aspire score will lead to a certain ACT score.
For example, in the English scores, both a 440 and 447 Aspire score led to a 31 ACT, and 428, 434, 436 and 437 all mapped to a 22 ACT.
From these tables, we can observe the following general ranges:
Aspire 400-420: ACT 1-16
Aspire 420-430: ACT 12-24
Aspire 430-440: ACT 20-32
Aspire 440+: ACT 26-36
These ranges are just estimates. For example, note that there were no scores higher than 440 for the Reading section, though ACT scores in the 30s were still reported.
Obviously, this isn’t nearly as neat as the old Plan predictions, where you could simply add 1 to 5 points to your Plan score to guess your ACT score. Plus, there are other complicating factors that make it hard to predict an ACT score based on the Aspire score.
Since the test scales are different, the score predictions for Aspire aren’t quite as straightforward as they were for Plan. Whereas the Plan used an ACT-like scale, Aspire has to translate the 390-470 scale to the ACT 1-36 scale. Although ranges can be created, like we showed above, they are certainly less straightforward.
As we’ve seen, the ACT Aspire and the ACT are very different tests. One student might do better on Aspire – since it has free response, short answer, and more question variability – while another might do better on a straightforward multiple-choice test like the ACT. Unlike the Plan (as well as the PSAT compared to the SAT), there isn’t as much similarity between the Aspire and the ACT, making score mapping difficult.
Furthermore, taking a computer-based test is quite different from a paper-and-pencil one. Since you can usually see only one question at a time on the computer, it could be easier for some students to focus on the Aspire. Also, it only takes a split-second to log an answer choice, whereas for paper-and-pencil tests, bubbling takes time. These differences could cause a student to do better on Aspire than the ACT – especially if they lose the paper-taking test practice the Plan used to give them.
Taking the ACT, unless you live in a state where all students take it, is different than taking a test in school. You wake up early on a Saturday, make sure you have a very specific set of supplies (admission ticket, I.D., No. 2 pencils, calculator), and psych yourself up to do well.
Taking a test in school, even required state testing, can blend into a regular school day. Students likely won’t feel the same motivation to do super well as they will when taking the ACT, since the ACT directly affects college admissions.
Students may tend to try harder and focus more on the ACT than the Aspire, which could easily allow them to outscore their Aspire predictions.
It’s much more likely students will do extra studying on their own for the ACT. It’s very unlikely a student would study outside of class for Aspire, since the test doesn’t matter to their personal college admission goals. Any studying for Aspire would likely happen in school, at the discretion of teachers.
Because of that, it’s very likely a student who doesn’t do well on Aspire could still earn a very good ACT score by studying specifically for the ACT.
It’s also possible a student who does well on Aspire, with its varying question types and computer-based format, will struggle on the ACT, which is nearly all multiple choice and has very intense pacing.
The ACT Aspire will give you decent information about your progress in school and likely performance on the ACT. For example, its data might let you know you are ahead of your grade in reading and science but are behind on some math concepts, which will help you focus your studying for the ACT on the math section.
However, don’t take the predicted ACT score as fact, since Aspire and the ACT are so different, and the Aspire is so new.
At the end of the day, a much better predictor of your ACT score is the amount of quality studying you put in before the test. Even if you have a super-high Aspire score, you can’t walk into the ACT without studying and expect a 36. It’s a very tricky test that’s quite different from Aspire.
And if you’re really curious about how well you’ll do on the ACT, taking an actual ACT practice test is a better predictor. If you’re a freshman or sophomore, you could add between 1 and 5 points – like the Plan did – to your practice test score to predict your ACT potential.
But remember that you have the most control over your future ACT score. Instead of getting caught up in predictions, get caught up in studying!
Speaking of studying, start planning out an ACT study schedule with our exclusive guide. Putting in the time, hour for hour, is the best way to improve your college admissions chances!
Learn more about how the ACT is scored to help you come up with a target raw score.